Market Outlook
November 04, 2016
Market Cues
Domestic Indices
Chg (%)
(Pts)
(Close)
Indian markets are likely to open negative tracking global cues and SGX Nifty.
BSE Sensex
(0.4)
(97)
27,430
Nifty
(0.3)
(29)
8,485
Late afternoon yesterday, government announced slabs of the proposed GST bill,
Mid Cap
(1.4)
(179)
13,015
clearing a major hurdle in implementation of the new tax regime. The markets are
Small Cap
(1.1)
(140)
13,167
expected to focus on the impact of the GST on individual sectors. More than 50% of
the items in the Consumer Price Index basket would be exempted under GST and
Bankex
(0.3)
(77)
21,917
the remainder will be placed in the lowest bracket. This will lead to soften the
inflation after implementation. Overall market is likely to react to the GST news.
Global Indices
Chg (%)
(Pts)
(Close)
U.S. markets closed lower Thursday, marking the S&P 500’s longest losing streak
Dow Jones
(0.2)
(29)
17,931
since the depths of the financial crisis, as Facebook shares slumped and investors
Nasdaq
(0.9)
(47)
5,058
fretted over election uncertainty. Markets are remaining focused on the outcome of
FTSE
(0.8)
(55)
6,791
next week’s U.S. presidential election.
Nikkei
(1.8)
(308)
17,135
UK markets fell on Thursday after the government lost a court case on how to trigger
Hang Seng
(0.6)
(127)
22,684
the process for leaving the European Union and the Bank of England shifted away
Shanghai Com
0.8
26
3,129
from cutting interest rates further.
Sensex plummeted some 97 points to hit nearly four-month low of 27,430.28,
Advances / Declines
BSE
NSE
falling for the fourth straight session, and Nifty crashed below the key 8,500-level on
Advances
1,168
466
Thursday, tracking cautious global markets amid a new poll suggesting a likely win
Declines
1,801
1,170
for Donald Trump in US election.
Unchanged
124
74
News Analysis
Volumes (` Cr)
GST rate structure finalised, panel fixes rates at 5%, 12%, 18% & 28%
Detailed analysis on Pg2
BSE
3,202
NSE
19,600
Investor’s Ready Reckoner
Key Domestic & Global Indicators
Net Inflows (` Cr)
Net
Mtd
Ytd
Stock Watch: Latest investment recommendations on 150+ stocks
FII
(614)
(710)
44,305
Refer Pg6 onwards
MFs
560
8,106
22,052
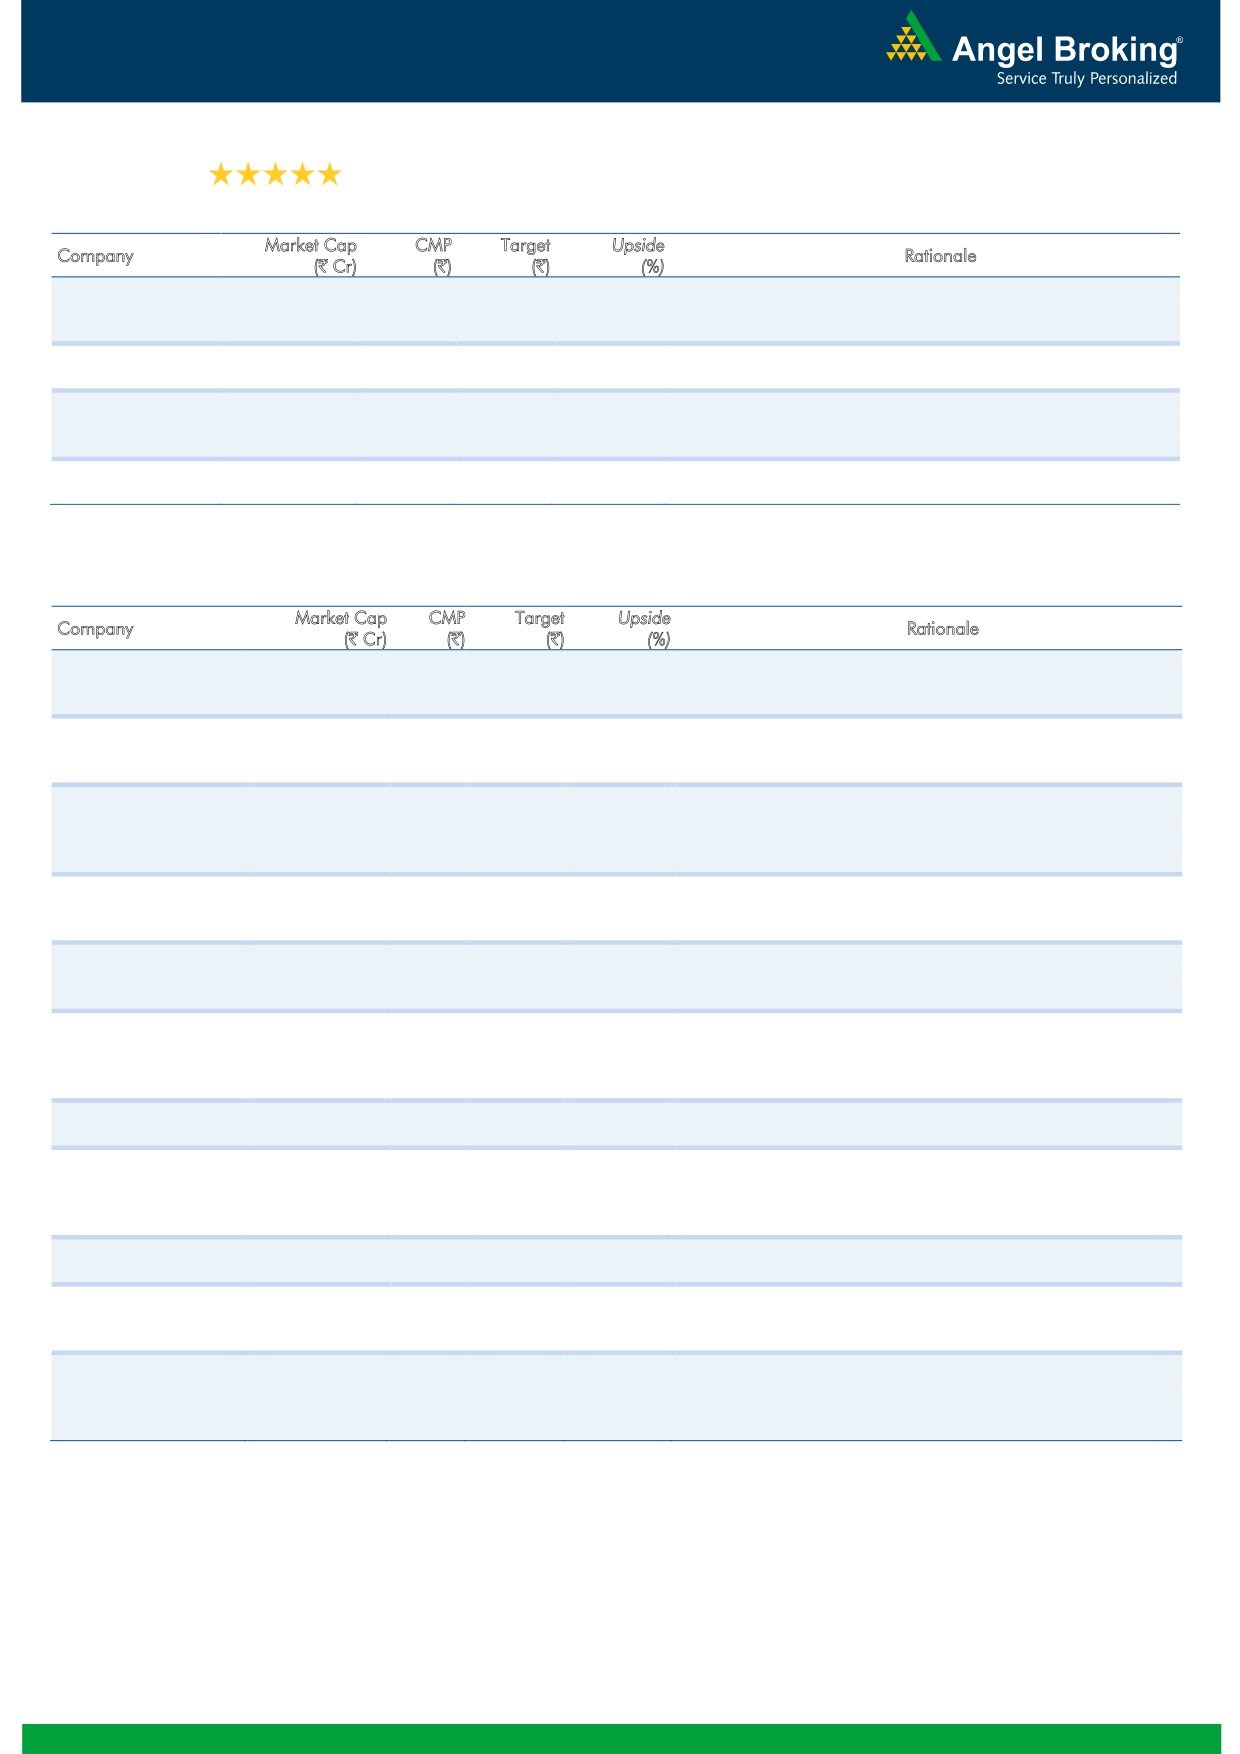
Top Picks
CMP
Target
Upside
Company
Sector
Rating
Top Gainers
Price (`)
Chg (%)
(`)
(`)
(%)
Amara Raja Batteries Auto & Auto Ancill.
Buy
1,024
1,218
18.9
Gvkpil
7
10.3
HCL Tech
IT
Buy
762
1,000
31.2
Star
1,124
7.2
Asian Granito
Capital Goods
Buy
265
351
32.5
Infratel
381
4.0
Equitas Holdings
Financials
Buy
178
235
32.2
Hindalco
162
3.9
Navkar Corporation Others
Buy
202
265
31.2
Balkrisind
1,036
2.4
More Top Picks on Pg4
Key Upcoming Events
Top Losers
Price (`)
Chg (%)
Previous
Consensus
Date
Region
Event Description
Reading
Expectations
Ttkprestig
5,953
(8.7)
Nov 04 US
Unnemployment rate
5.00
4.90
Intellect
169
(7.9)
Nov 04 Germany
PMI Services
54.10
54.10
Cesc
591
(5.4)
Nov 04 US
Change in Nonfarm payrolls
156.00
175.00
Indhotel
109
(4.6)
Nov 08 China
Consumer Price Index (YoY)
1.90
2.10
Dishtv
89
(4.4)
Nov 08 China
Exports YoY%
(10.00)
(5.80)
6.(
As on November 03, 2016
More Events on Pg5
Market Outlook
November 04, 2016
News analysis
GST rate structure finalised, panel fixes rates at 5%, 12%, 18% &
28%
GST council finalised a 4-tier GST tax structure of 5, 12, 18 and 28 per cent, with
lower rates for essential items and the highest for luxury and de-merits goods that
would also attract an additional cess. GST regime is expected to bring uniform tax
system in country with an aim to lower the prices of goods and services and
improve overall ease of doing business which will benefit India Inc. There still
remains a lot of uncertainty regarding the new structure and classification goods
under different tax rates. GST is targeted to be rolled out from April 1, 2017.
With a view to keeping inflation under check, 50% of the items in consumer price
index basket, will be taxed at zero rate and remaining items will be taxed at the
lowest rate of 5 per cent. There would be two standard rates of 12 and 18 per cent
under GST and most other items would attract this rate.
Soaps, oil, shaving kits, small cars and other goods consumed by the middle
class, which faces higher tax incidence of 30-31% including state and central
taxes, could become cheaper as they are likely to be placed in the lower tax
slab of 18% and not the equivalent tax slab of 28%.
Luxury cars, tobacco and aerated drinks would also be levied with an
additional cess on top of the highest tax rate. Tobacco currently attracts a
total tax of about 65% and for aerated drinks, the current rate is about 40%.
These goods will be taxed at the highest rate of 28% and topped up with a
cess to raise the effective tax.
Sports utility vehicles, aerated drinks, pan masala and tobacco products are
unlikely to see any change in their overall tax burden with a new cess
proposed on them.
Businesses in the services sector such as telecom, banking, insurance,
airlines, e-commerce undertake pan India operations and meeting
requirements of each state through different registrations, audits and
compliances would be a massive task.
Overall the new tax regime looks positive for FMCG, Infrastructure and
Automobile sector. More clarity regarding the classification of goods under GST is
required.
Market Outlook
November 04, 2016
Quarterly Bloomberg Brokers Consensus Estimate
Union Bank Of India Ltd - Nov 4, 2016
Particulars ( ` cr)
2QFY17E
2QFY16
y-o-y (%)
1QFY17
q-o-q (%)
Net profit
203
658
(69.2)
166
22.1
Titan Ltd - Nov 4, 2016
Particulars ( ` cr)
2QFY17E
2QFY16
y-o-y (%)
1QFY17
q-o-q (%)
Net sales
3,058
2,655
15.2
2,783
9.9
EBITDA
275
203
35.5
292
(5.9)
EBITDA margin (%)
9.0
7.6
10.5
Net profit
180
145
23.8
127
42.1
United Breweries Ltd - Nov 4, 2016
Particulars ( ` cr)
2QFY17E
2QFY16
y-o-y (%)
1QFY17
q-o-q (%)
Net sales
1,640
1,016
61.3
1,486
10.4
EBITDA
296
150
97.1
290
2.1
EBITDA margin (%)
18.0
14.8
19.5
Net profit
142
48
194.2
147
(3.6)
Punjab National Bank Ltd - Nov 5, 2016
Particulars ( ` cr)
2QFY17E
2QFY16
y-o-y (%)
1QFY17
q-o-q (%)
Net profit
125
621
(80.0)
306
(59.4)
Economic and Political News
GST rate structure finalised, panel fixes rates at 5%, 12%, 18% & 28%
RBI allows banks to issue masala bonds
Govt to keep wheat import tax at 10%, private imports seen at 3 million
tonnes
Corporate News
ONGC, Cairn face `1,922cr tax on royalty payments
ICICI Bank slashes home loan rate by 15 bps to 9.15%
JSPL again defaults on interest payment
Market Outlook
November 04, 2016
Top Picks
Large Cap
M
arket Cap
CM
P
T
arget
Upsid
e
Company
Rationale
(` Cr)
(`)
(`)
(%)
To outpace battery industry growth due to better technological
Amara Raja Batteries
17,495
1,024
1,218
18.9
products leading to market share gains in both the
automotive OEM and replacement segments.
The stock is trading at attractive valuations and is factoring all
HCL Tech
1,07,507
762
1,000
31.2
the bad news.
Strong visibility for a robust 20% earnings trajectory, coupled
HDFC Bank
3,18,139
1,257
1,350
7.4
with high quality of earnings on account of high quality retail
business and strategic focus on highly rated corporates.
Back on the growth trend, expect a long term growth of 14%
Infosys
2,22,092
967
1,249
29.1
to be a US$20bn in FY2020.
Source: Company, Angel Research
Mid Cap
M
arket Cap
CM
P
T
arget
Upsid
e
Company
Rationale
(` Cr)
(`)
(`)
(%)
We expect the company would report strong profitability
Asian Granito
797
265
351
32.5
owing to better product mix, higher B2C sales and
amalgamation synergy.
Among the top 4 players in the consumer durables segment.
Bajaj Electricals
2,600
257
306
19.0
Improved profitability backed by turn around in E&P segment.
Strong order book lends earnings visibility.
Favourable outlook for the AC industry to augur well for
Cooling products business which is out pacing the market
Blue Star
5,244
550
634
15.3
growth. EMPPAC division's profitability to improve once
operating environment turns around.
With a focus on the low and medium income (LMI) consumer
Dewan Housing Finance
9,710
310
350
12.8
segment, the company has increased its presence in tier-II &
III cities where the growth opportunity is immense.
Strong loan growth backed by diversified loan portfolio and
Equitas Holdings
5,963
178
235
32.2
adequate CAR. ROE & ROA likely to remain decent as risk of
dilution remains low. Attractive valuations considering growth.
Economic recovery to have favourable impact on advertising
& circulation revenue growth. Further, the acquisition of a
Jagran Prakashan
6,043
185
225
21.7
radio business (Radio City) would also boost the company's
revenue growth.
Speedier execution and speedier sales, strong revenue visibilty
Mahindra Lifespace
1,709
416
522
25.3
in short-to-long run, attractive valuations
We expect the company to report strong growth on back of
healthy growth in domestic branded sales (owing to
Mirza International
1,074
89
113
26.5
aggressive ad spend and addition in the number of EBOs &
multi-brand outlets [MBOs]) and healthy export revenues.
Massive capacity expansion along with rail advantage at ICD
Navkar Corporation
2,881
202
265
31.2
as well CFS augurs well for the company.
Strong brands and distribution network would boost growth
Siyaram Silk Mills
1,448
1,545
1,714
11.0
going ahead. Stock currently trades at an inexpensive
valuation.
Market leadership in Hindi news genre and no. 2 viewership
ranking in English news genre, exit from the radio business,
TV Today Network
2,024
339
385
13.5
and anticipated growth in ad spends by corporates to benefit
the stock.
Source: Company, Angel Research
Market Outlook
November 4, 2016
Key Upcoming Events
Result Calendar
Date
Company
Union Bank, Allahabad Bank, Central Bank, Competent Automobiles, Transport Corporation of India,
November 04, 2016
Radico Khaitan
Amara Raja Batteries, Automotive Axle, Mangalam Cement, Punjab Natl.Bank, Dena Bank, Bank of
November 05, 2016
Maharashtra, Relaxo, Sterling Tools
November 07, 2016 CEAT, ICICI Bank, Godrej Consumer, GlaxoSmith Con, Britannia, Cravatex, Aventis
November 08, 2016 Bharat Forge, Ashok Leyland, BHEL, Vesuvius India, UFO Moviez
November 09, 2016 Apollo Tyres, Ramco Cements, Rural Elec.Corp., BPCL, ITD Cementation, Lupin
Source: Bloomberg, Angel Research
Global economic events release calendar
Bloomberg Data
Date
Time
Country
Event Description
Unit
Period
Last Reported
Estimated
Nov 04, 2016
6:00 PM
US
Change in Nonfarm payrolls
Thousands Oct
156.00
175.00
2:25 PM Germany
PMI Services
Value Oct F
54.10
54.10
6:00 PM
US
Unnemployment rate
% Oct
5.00
4.90
Nov 08, 2016
7:00 AM
China
Consumer Price Index (YoY)
% Change Oct
1.90
2.10
China
Exports YoY%
% Change Oct
(10.00)
(5.80)
Nov 09, 2016
3:00 PM
UK
Industrial Production (YoY)
% Change Sep
0.70
Nov 10, 2016
India
Imports YoY%
% Change Oct
(2.50)
India
Exports YoY%
% Change Oct
4.60
Nov 11, 2016
5:30 PM
India
Industrial Production YoY
% Change Sep
(0.70)
Nov 14, 2016
7:30 AM
China
Industrial Production (YoY)
% Change Oct
6.10
6.20
12:00 PM
India
Monthly Wholesale Prices YoY%
% Change Oct
3.57
Nov 15, 2016
3:30 PM Euro Zone
Euro-Zone GDP s.a. (QoQ)
% Change 3Q P
0.30
3:00 PM
UK
CPI (YoY)
% Change Oct
1.00
12:30 PM Germany
GDP nsa (YoY)
% Change 3Q P
3.10
Nov 16, 2016
3:00 PM
UK
Jobless claims change
% Change Oct
0.70
US
Producer Price Index (mom)
% Change Oct
0.80
7:45 PM
US
Industrial Production
% Oct
0.06
0.10
Nov 17, 2016
7:00 PM
US
Housing Starts
Thousands Oct
1,047.00
1,120.00
7:00 PM
US
Building permits
Thousands Oct
1,225.00
1,190.00
Source: Bloomberg, Angel Research
Market Outlook
November 04, 2016
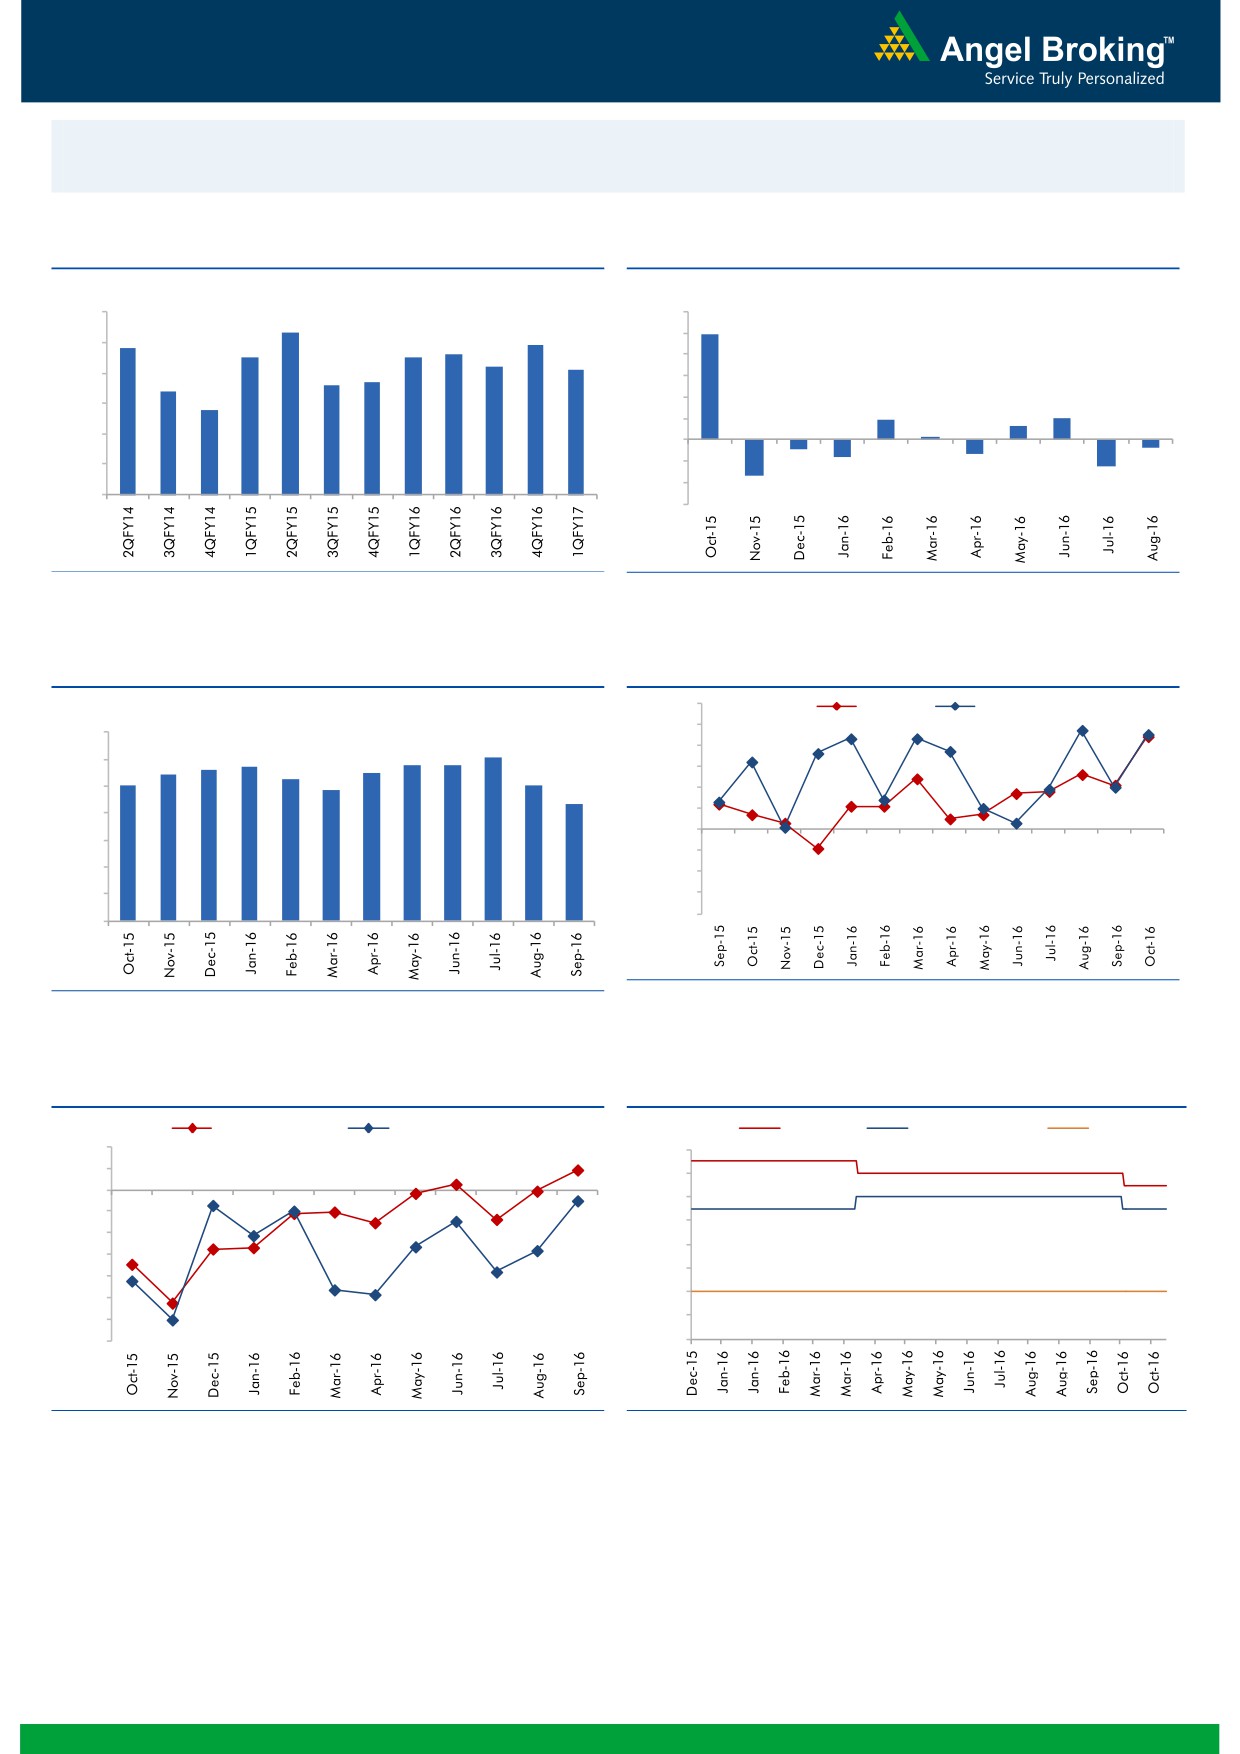
Macro watch
Exhibit 1: Quarterly GDP trends
Exhibit 2: IIP trends
(%)
(%)
9.0
12.0
8.3
9.9
7.8
7.9
10.0
8.0
7.5
7.5
7.6
7.2
7.1
8.0
6.6
6.7
7.0
6.4
6.0
5.8
6.0
4.0
1.9
2.0
1.3
2.0
0.3
5.0
-
4.0
(2.0)
(0.7)
(0.9)
(1.3)
(1.6)
(4.0)
(2.5)
3.0
(3.4)
(6.0)
Source: CSO, Angel Research
Source: MOSPI, Angel Research
Exhibit 3: Monthly CPI inflation trends
Exhibit 4: Manufacturing and services PMI
56.0
Mfg. PMI
Services PMI
(%)
55.0
7.0
6.1
54.0
5.6
5.7
5.8
5.8
6.0
5.4
5.5
5.0
5.3
5.1
53.0
4.8
5.0
4.3
52.0
4.0
51.0
50.0
3.0
49.0
2.0
48.0
1.0
47.0
46.0
-
Source: Market, Angel Research; Note: Level above 50 indicates expansion
Source: MOSPI, Angel Research
Exhibit 5: Exports and imports growth trends
Exhibit 6: Key policy rates
(%)
Exports yoy growth
Imports yoy growth
(%)
Repo rate
Reverse Repo rate
CRR
10.0
7.00
5.0
6.50
0.0
6.00
(5.0)
5.50
(10.0)
5.00
(15.0)
4.50
(20.0)
4.00
(25.0)
(30.0)
3.50
(35.0)
3.00
Source: Bloomberg, Angel Research
Source: RBI, Angel Research
Market Outlook
November 04, 2016
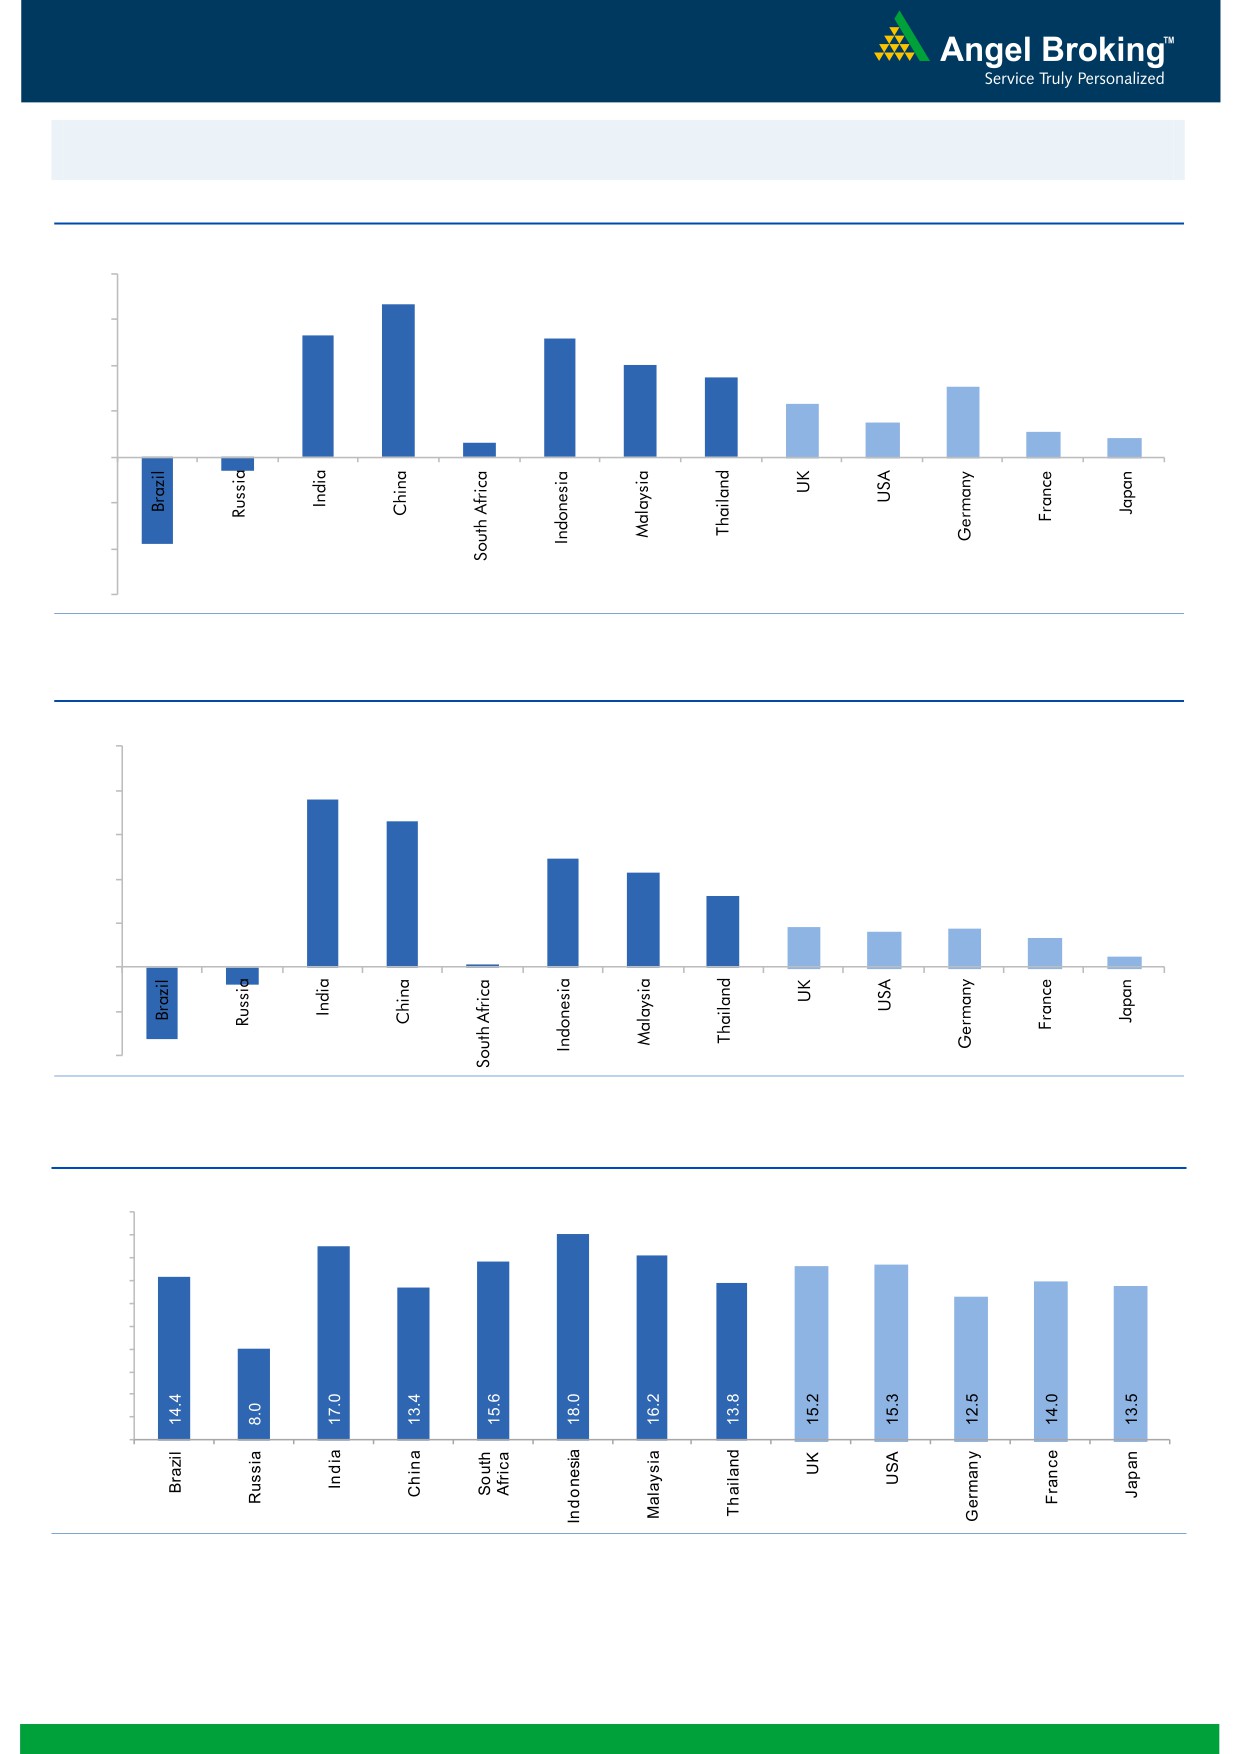
Global watch
Exhibit 1: Latest quarterly GDP Growth (%, yoy) across select developing and developed countries
(%)
8.0
6.7
6.0
5.3
0.6
5.2
4.0
3.5
4.0
3.1
2.3
1.5
2.0
1.1
0.8
-
(2.0)
(0.6)
(4.0)
(3.8)
(6.0)
Source: Bloomberg, Angel Research
Exhibit 2: 2016 GDP Growth projection by IMF (%, yoy) across select developing and developed countries
(%)
10.0
7.6
8.0
6.6
6.0
4.9
4.3
4.0
3.2
1.8
1.7
1.6
2.0
1.3
(0.8)
0.5
(3.3)
0.1
-
(2.0)
(4.0)
Source: IMF, Angel Research
Exhibit 3: One year forward P-E ratio across select developing and developed countries
(x)
20.0
18.0
16.0
14.0
12.0
10.0
8.0
6.0
4.0
2.0
-
Source: IMF, Angel Research
Market Outlook
November 04, 2016
Exhibit 4: Relative performance of indices across globe
Returns (%)
Country
Name of index
Closing price
1M
3M
1YR
Brazil
Bovespa
61,750
8.5
11.6
34.6
Russia
Micex
1,963
(0.8)
1.3
11.6
India
Nifty
8,485
(1.5)
(1.8)
3.1
China
Shanghai Composite
3,129
4.4
4.6
(8.8)
South Africa
Top 40
43,712
(3.9)
(4.1)
(10.0)
Mexico
Mexbol
46,684
0.1
1.6
4.3
Indonesia
LQ45
907
(4.1)
(1.5)
11.6
Malaysia
KLCI
1,648
(0.8)
(1.0)
(2.9)
Thailand
SET 50
932
(1.9)
(2.2)
1.9
USA
Dow Jones
17,931
(1.6)
(2.2)
0.5
UK
FTSE
6,791
(4.0)
0.7
6.9
Japan
Nikkei
17,135
4.2
3.4
(9.0)
Germany
DAX
10,326
(2.3)
1.4
(5.6)
France
CAC
4,412
(1.5)
0.6
(8.6)
Source: Bloomberg, Angel Research
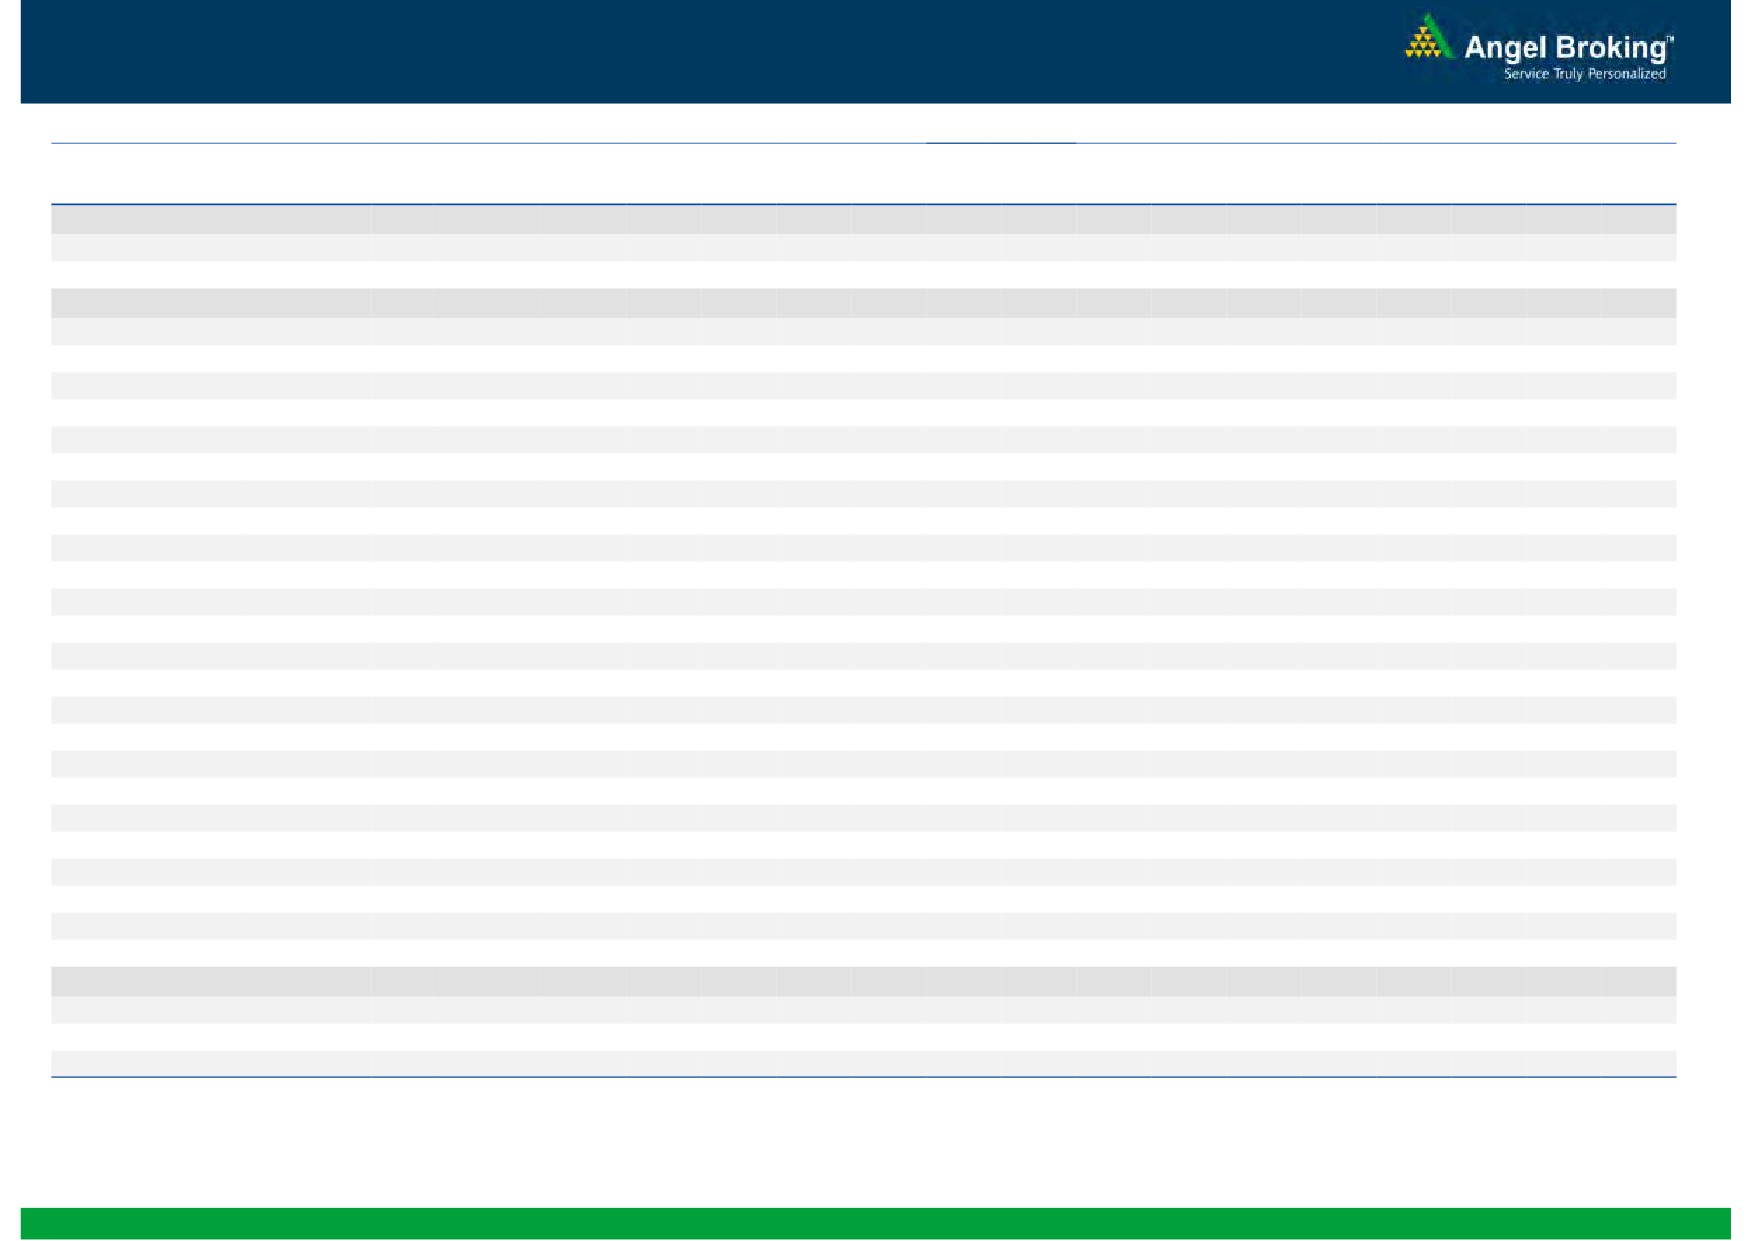
Stock Watch
November 04, 2016
Company Name
Reco
CMP
Target
Mkt Cap
Sales ( Čcr )
OPM(%)
EPS (Č)
PER(x)
P/BV(x)
RoE(%)
EV/Sales(x)
(Č)
Price ( Č)
( Č cr )
FY17E FY18E
FY17E
FY18E
FY17E
FY18E
FY17E
FY18E
FY17E
FY18E
FY17E
FY18E
FY17E
FY18E
Agri / Agri Chemical
Rallis
Neutral
214
-
4,162
1,937
2,164
13.3
14.3
9.0
11.0
23.8
19.5
4.1
3.6
18.4
19.8
2.2
1.9
United Phosphorus
Neutral
669
-
33,915
15,176
17,604
18.5
18.5
37.4
44.6
17.9
15.0
3.5
2.9
21.4
21.2
2.3
2.0
Auto & Auto Ancillary
Ashok Leyland
Buy
91
111
25,897
22,407
26,022
10.6
10.6
5.2
6.4
17.4
14.2
3.9
3.3
23.6
24.7
1.2
1.0
Bajaj Auto
Neutral
2,831
-
81,933
25,093
27,891
19.5
19.2
143.9
162.5
19.7
17.4
5.5
4.7
30.3
29.4
3.0
2.6
Bharat Forge
Neutral
851
-
19,817
7,726
8,713
20.5
21.2
35.3
42.7
24.1
19.9
4.5
4.0
18.9
20.1
2.6
2.3
Eicher Motors
Neutral
24,549
-
66,679
16,583
20,447
17.5
18.0
598.0
745.2
41.1
32.9
14.0
10.7
41.2
38.3
3.8
3.1
Gabriel India
Accumulate
122
130
1,749
1,544
1,715
9.0
9.3
5.4
6.3
22.6
19.3
4.3
3.8
18.9
19.5
1.1
1.0
Hero Motocorp
Neutral
3,380
-
67,484
30,958
34,139
15.7
15.7
193.6
208.3
17.5
16.2
6.8
5.6
34.2
30.5
2.0
1.8
Jamna Auto Industries Neutral
220
-
1,756
1,486
1,620
9.8
9.9
15.0
17.2
14.7
12.8
3.2
2.7
21.8
21.3
1.2
1.1
L G Balakrishnan & Bros Neutral
661
-
1,037
1,302
1,432
11.6
11.9
43.7
53.0
15.1
12.5
2.1
1.9
13.8
14.2
0.9
0.8
Mahindra and Mahindra Neutral
1,359
-
84,379
46,534
53,077
11.6
11.7
67.3
78.1
20.2
17.4
3.3
2.9
15.4
15.8
1.8
1.5
Maruti
Neutral
5,807
-
175,406
69,186
82,217
14.7
14.4
198.5
241.4
29.3
24.1
5.7
4.6
20.2
20.0
2.2
1.8
Minda Industries
Neutral
383
-
3,041
2,728
3,042
9.0
9.1
68.2
86.2
5.6
4.5
1.3
1.0
23.8
24.3
1.2
1.0
Motherson Sumi
Neutral
314
-
44,059
45,896
53,687
7.8
8.3
13.0
16.1
24.1
19.5
7.8
6.2
34.7
35.4
1.0
0.9
Rane Brake Lining
Neutral
1,013
-
802
511
562
11.3
11.5
28.1
30.9
36.1
32.8
5.5
5.0
15.3
15.0
1.7
1.6
Setco Automotive
Neutral
42
-
560
741
837
13.0
13.0
15.2
17.0
2.8
2.5
0.5
0.4
15.8
16.3
1.1
1.0
Tata Motors
Neutral
510
-
147,320
300,209
338,549
8.9
8.4
42.7
54.3
12.0
9.4
1.9
1.6
15.6
17.2
0.6
0.5
TVS Motor
Neutral
392
-
18,635
13,390
15,948
6.9
7.1
12.8
16.5
30.7
23.7
7.7
6.1
26.3
27.2
1.4
1.2
Amara Raja Batteries
Buy
1,024
1,218
17,495
5,429
6,471
17.5
17.6
35.3
43.5
29.0
23.6
6.7
5.4
25.3
24.8
3.1
2.5
Exide Industries
Neutral
193
-
16,392
7,439
8,307
15.0
15.0
8.1
9.3
23.8
20.7
3.3
3.0
14.3
16.7
1.8
1.6
Apollo Tyres
Buy
198
235
10,071
12,877
14,504
14.3
13.9
21.4
23.0
9.2
8.6
1.4
1.3
16.4
15.2
0.9
0.9
Ceat
Buy
1,232
1,450
4,984
7,524
8,624
13.0
12.7
131.1
144.3
9.4
8.5
1.7
1.5
19.8
18.6
0.7
0.6
JK Tyres
Neutral
143
-
3,237
7,455
8,056
15.0
15.0
21.8
24.5
6.6
5.8
1.4
1.1
22.8
21.3
0.6
0.5
Swaraj Engines
Neutral
1,385
-
1,720
660
810
15.2
16.4
54.5
72.8
25.4
19.0
7.9
7.2
31.5
39.2
2.4
2.0
Subros
Neutral
164
-
983
1,488
1,681
11.7
11.9
6.4
7.2
25.6
22.9
2.7
2.5
10.8
11.4
0.9
0.8
Indag Rubber
Neutral
189
-
495
286
326
19.8
16.8
11.7
13.3
16.1
14.1
2.7
2.5
17.8
17.1
1.4
1.2
Capital Goods
ACE
Neutral
55
-
543
709
814
4.1
4.6
1.4
2.1
39.2
26.1
1.6
1.5
4.4
6.0
0.9
0.8
BEML
Neutral
891
-
3,712
3,451
4,055
6.3
9.2
31.4
57.9
28.4
15.4
1.7
1.6
6.3
10.9
1.2
1.0
Bharat Electronics
Accumulate
1,305
1,414
31,328
8,137
9,169
16.8
17.2
58.7
62.5
22.2
20.9
3.4
3.1
44.6
46.3
2.8
2.5
Stock Watch
November 04, 2016
Company Name
Reco
CMP
Target
Mkt Cap
Sales ( Čcr )
OPM(%)
EPS (Č)
PER(x)
P/BV(x)
RoE(%)
EV/Sales(x)
(Č)
Price ( Č)
( Č cr )
FY17E
FY18E
FY17E
FY18E
FY17E
FY18E
FY17E
FY18E
FY17E
FY18E
FY17E
FY18E
FY17E
FY18E
Capital Goods
Voltas
Accumulate
364
407
12,057
6,511
7,514
7.9
8.7
12.9
16.3
28.3
22.4
5.1
4.5
16.7
18.5
1.6
1.4
BGR Energy
Neutral
117
-
846
16,567
33,848
6.0
5.6
7.8
5.9
15.0
19.9
0.9
0.8
4.7
4.2
0.2
0.1
BHEL
Neutral
138
-
33,716
28,797
34,742
-
2.8
2.3
6.9
59.9
20.0
1.0
1.0
1.3
4.8
0.8
0.6
Blue Star
Buy
550
634
5,244
4,283
5,077
5.9
7.3
14.9
22.1
36.9
24.9
7.2
6.0
20.4
26.4
1.3
1.1
Crompton Greaves
Neutral
77
-
4,810
5,777
6,120
5.9
7.0
3.3
4.5
23.3
17.1
1.0
1.0
4.4
5.9
0.8
0.7
Greaves Cotton
Neutral
136
-
3,322
1,755
1,881
16.8
16.9
7.8
8.5
17.4
16.0
3.5
3.2
20.6
20.9
1.6
1.4
Inox Wind
Neutral
215
-
4,767
5,605
6,267
15.7
16.4
24.8
30.0
8.7
7.2
2.4
1.8
25.9
24.4
0.9
0.8
KEC International
Neutral
123
-
3,167
9,294
10,186
7.9
8.1
9.9
11.9
12.4
10.4
1.8
1.6
15.6
16.3
0.6
0.5
Thermax
Neutral
854
-
10,180
5,421
5,940
7.3
7.3
25.7
30.2
33.2
28.3
4.0
3.7
12.2
13.1
1.8
1.6
VATech Wabag
Buy
481
681
2,624
3,136
3,845
8.9
9.1
26.0
35.9
18.5
13.4
2.3
2.0
13.4
15.9
0.7
0.6
Cement
ACC
Neutral
1,509
-
28,335
11,225
13,172
13.2
16.9
44.5
75.5
33.9
20.0
3.2
3.0
11.2
14.2
2.5
2.2
Ambuja Cements
Neutral
243
-
48,291
9,350
10,979
18.2
22.5
5.8
9.5
41.9
25.6
3.5
3.2
10.2
12.5
5.2
4.4
India Cements
Neutral
152
-
4,654
4,364
4,997
18.5
19.2
7.9
11.3
19.2
13.4
1.4
1.3
8.0
8.5
1.8
1.6
JK Cement
Neutral
881
-
6,164
4,398
5,173
15.5
17.5
31.2
55.5
28.3
15.9
3.4
2.9
12.0
15.5
2.0
1.6
J K Lakshmi Cement
Buy
479
565
5,636
2,913
3,412
14.5
19.5
7.5
22.5
63.9
21.3
3.9
3.3
12.5
18.0
2.5
2.1
Orient Cement
Buy
173
215
3,538
2,114
2,558
18.5
20.5
8.1
11.3
21.3
15.3
3.1
2.7
9.0
14.0
2.3
1.8
UltraTech Cement
Neutral
3,907
-
107,231
25,768
30,385
21.0
23.5
111.0
160.0
35.2
24.4
4.5
3.9
13.5
15.8
4.3
3.5
Construction
ITNL
Neutral
101
-
3,337
8,946
10,017
31.0
31.6
8.1
9.1
12.5
11.2
0.5
0.5
4.2
5.0
3.7
3.4
KNR Constructions
Accumulate
716
802
2,012
1,385
1,673
14.7
14.0
41.2
48.5
17.4
14.8
3.2
2.8
14.9
15.2
1.5
1.3
Larsen & Toubro
Buy
1,445
1,700
134,633
67,665
77,249
10.7
11.5
57.3
71.2
25.2
20.3
2.3
2.2
12.6
14.3
2.2
1.9
Gujarat Pipavav Port
Neutral
169
-
8,192
705
788
52.2
51.7
5.0
5.6
33.9
30.3
3.3
3.0
11.2
11.2
11.3
9.6
Nagarjuna Const.
Neutral
86
-
4,784
8,842
9,775
9.1
8.8
5.3
6.4
16.2
13.5
1.3
1.2
8.2
9.1
0.7
0.6
PNC Infratech
Buy
118
143
3,016
2,350
2,904
13.1
13.2
9.0
8.8
13.1
13.4
0.5
0.4
15.9
13.9
1.4
1.1
Simplex Infra
Neutral
323
-
1,596
6,829
7,954
10.5
10.5
31.4
37.4
10.3
8.6
1.1
1.0
9.9
13.4
0.7
0.6
Power Mech Projects
Neutral
492
-
723
1,801
2,219
12.7
14.6
72.1
113.9
6.8
4.3
1.3
1.1
16.8
11.9
0.4
0.3
Sadbhav Engineering
Accumulate
264
298
4,532
3,598
4,140
10.3
10.6
9.0
11.9
29.4
22.2
3.1
2.7
9.9
11.9
1.5
1.3
NBCC
Neutral
235
-
14,112
7,428
9,549
7.9
8.6
8.2
11.0
28.7
21.4
1.4
1.1
28.2
28.7
1.6
1.2
MEP Infra
Neutral
41
-
667
1,877
1,943
30.6
29.8
3.0
4.2
13.7
9.8
6.6
4.5
0.6
0.6
1.7
1.6
SIPL
Neutral
100
-
3,522
1,036
1,252
65.5
66.2
(8.4)
(5.6)
3.8
4.3
(22.8)
(15.9)
11.6
9.7
Stock Watch
November 04, 2016
Company Name
Reco
CMP
Target
Mkt Cap
Sales ( Čcr )
OPM(%)
EPS (Č)
PER(x)
P/BV(x)
RoE(%)
EV/Sales(x)
(Č)
Price ( Č)
( Č cr )
FY17E
FY18E
FY17E
FY18E
FY17E
FY18E
FY17E
FY18E
FY17E
FY18E
FY17E
FY18E
FY17E
FY18E
Construction
Engineers India
Neutral
251
-
8,462
1,725
1,935
16.0
19.1
11.4
13.9
22.0
18.1
3.0
2.9
13.4
15.3
3.8
3.4
Financials
Axis Bank
Buy
476
630
113,502
46,932
53,575
3.5
3.4
32.4
44.6
14.7
10.7
1.9
1.6
13.6
16.5
-
-
Bank of Baroda
Neutral
147
-
33,791
19,980
23,178
1.8
1.8
11.5
17.3
12.8
8.5
1.5
1.2
8.3
10.1
-
-
Canara Bank
Neutral
296
-
16,067
15,225
16,836
1.8
1.8
14.5
28.0
20.4
10.6
1.4
1.1
5.8
8.5
-
-
Dewan Housing Finance Accumulate
310
350
9,710
2,225
2,688
2.9
2.9
29.7
34.6
10.4
9.0
1.7
1.4
16.1
16.8
-
-
Equitas Holdings
Buy
178
235
5,963
939
1,281
11.7
11.5
5.8
8.2
30.7
21.7
2.6
2.4
10.9
11.5
-
-
Federal Bank
Neutral
77
-
13,221
9,353
10,623
2.9
2.9
4.4
5.8
17.5
13.3
1.7
1.5
9.5
11.0
-
-
HDFC
Neutral
1,401
-
221,462
11,475
13,450
3.4
3.4
45.3
52.5
30.9
26.7
6.0
5.3
20.2
20.5
-
-
HDFC Bank
Accumulate
1,257
1,350
318,139
46,097
55,433
4.5
4.5
58.4
68.0
21.5
18.5
3.8
3.2
18.8
18.6
-
-
ICICI Bank
Neutral
270
-
157,001
39,029
45,903
3.3
3.3
16.7
16.3
16.2
16.6
2.0
1.8
10.1
12.4
-
-
LIC Housing Finance
Accumulate
553
630
27,883
3,712
4,293
2.6
2.5
39.0
46.0
14.2
12.0
2.7
2.3
19.9
20.1
-
-
Punjab Natl.Bank
Neutral
133
-
28,334
23,532
23,595
2.3
2.4
6.8
12.6
19.6
10.6
3.0
2.2
3.3
6.5
-
-
RBL Bank
Neutral
379
-
14,014
1,783
2,309
2.6
2.6
12.7
16.4
29.8
23.1
3.3
2.9
12.8
13.3
-
-
South Ind.Bank
Neutral
23
-
3,092
6,435
7,578
2.5
2.5
2.7
3.1
8.5
7.4
1.1
0.9
10.1
11.2
-
-
St Bk of India
Neutral
246
-
190,693
88,650
98,335
2.6
2.6
13.5
18.8
18.2
13.1
1.7
1.5
7.0
8.5
-
-
Union Bank
Neutral
137
-
9,421
13,450
14,925
2.3
2.3
25.5
34.5
5.4
4.0
0.8
0.7
7.5
10.2
-
-
Yes Bank
Neutral
1,207
-
50,829
8,978
11,281
3.3
3.4
74.0
90.0
16.3
13.4
3.1
2.6
17.0
17.2
-
-
FMCG
Asian Paints
Neutral
1,037
-
99,464
17,128
18,978
16.8
16.4
19.1
20.7
54.3
50.1
18.9
17.8
34.8
35.5
5.7
5.2
Britannia
Accumulate
3,304
3,626
39,638
9,795
11,040
14.6
14.9
80.3
94.0
41.1
35.2
16.9
13.1
41.2
-
3.9
3.4
Colgate
Neutral
952
-
25,879
4,605
5,149
23.4
23.4
23.8
26.9
40.0
35.4
22.1
17.3
64.8
66.8
5.5
4.9
Dabur India
Neutral
292
-
51,349
8,315
9,405
19.8
20.7
8.1
9.2
36.0
31.7
10.0
8.3
31.6
31.0
5.8
5.1
GlaxoSmith Con*
Neutral
5,883
-
24,741
4,350
4,823
21.2
21.4
179.2
196.5
32.8
30.0
8.7
7.4
27.1
26.8
5.1
4.5
Godrej Consumer
Neutral
1,537
-
52,338
10,235
11,428
18.4
18.6
41.1
44.2
37.4
34.8
8.3
7.0
24.9
24.8
5.2
4.6
HUL
Neutral
840
-
181,743
35,252
38,495
17.8
17.8
20.7
22.4
40.7
37.5
38.9
33.3
95.6
88.9
5.0
4.6
ITC
Buy
240
284
290,122
40,059
44,439
38.3
39.2
9.0
10.1
26.8
23.7
7.5
6.5
27.8
27.5
6.7
6.1
Marico
Accumulate
265
300
34,196
6,430
7,349
18.8
19.5
6.4
7.7
41.4
34.4
12.5
10.5
33.2
32.5
5.1
4.4
Nestle*
Neutral
6,712
-
64,714
10,073
11,807
20.7
21.5
124.8
154.2
53.8
43.5
22.1
19.9
34.8
36.7
6.2
5.3
Tata Global
Neutral
131
-
8,290
8,675
9,088
9.8
9.8
7.4
8.2
17.8
16.0
2.0
1.9
7.9
8.1
0.9
0.8
Procter & Gamble
Neutral
7,080
-
22,982
2,939
3,342
23.2
23.0
146.2
163.7
48.4
43.3
108.4
104.0
25.3
23.5
7.4
6.4
Hygiene
Stock Watch
November 04, 2016
Company Name
Reco
CMP
Target
Mkt Cap
Sales ( Čcr )
OPM(%)
EPS (Č)
PER(x)
P/BV(x)
RoE(%)
EV/Sales(x)
(Č)
Price ( Č)
( Č cr )
FY17E FY18E
FY17E
FY18E
FY17E
FY18E
FY17E
FY18E
FY17E
FY18E
FY17E
FY18E
FY17E
FY18E
IT
HCL Tech^
Buy
762
1,000
107,507
49,242
57,168
20.5
20.5
55.7
64.1
13.7
11.9
2.8
2.1
20.3
17.9
2.0
1.6
Infosys
Buy
967
1,249
222,092
68,350
77,326
27.0
27.0
62.5
69.4
15.5
13.9
3.3
3.0
21.3
21.6
2.7
2.3
TCS
Accumulate
2,320
2,620
457,129
119,025
133,308
27.6
27.6
131.2
145.5
17.7
15.9
5.7
5.3
32.4
33.1
3.6
3.2
Tech Mahindra
Buy
428
600
41,531
29,673
32,937
15.5
17.0
32.8
39.9
13.0
10.7
2.6
2.2
19.6
20.7
1.1
1.0
Wipro
Buy
448
590
108,982
55,440
60,430
18.1
18.1
35.9
39.9
12.5
11.2
2.2
2.1
19.0
19.3
1.7
1.5
Media
D B Corp
Neutral
380
-
6,980
2,297
2,590
27.4
28.2
21.0
23.4
18.1
16.2
4.2
3.7
23.7
23.1
2.8
2.4
HT Media
Neutral
82
-
1,910
2,693
2,991
12.6
12.9
7.9
9.0
10.4
9.1
0.9
0.8
7.8
8.3
0.3
0.2
Jagran Prakashan
Buy
185
225
6,043
2,355
2,635
28.0
28.0
10.8
12.5
17.1
14.8
3.7
3.2
21.7
21.7
2.6
2.3
Sun TV Network
Neutral
528
-
20,794
2,850
3,265
70.1
71.0
26.2
30.4
20.1
17.4
5.2
4.6
24.3
25.6
6.9
5.9
Hindustan Media
Neutral
299
-
2,195
1,016
1,138
24.3
25.2
27.3
30.1
11.0
9.9
2.1
1.9
16.2
15.8
1.5
1.3
Ventures
TV Today Network
Accumulate
339
385
2,024
637
743
27.5
27.5
18.4
21.4
18.5
15.9
3.2
2.7
17.4
17.2
2.8
2.3
Metals & Mining
Coal India
Neutral
327
-
206,387
84,638
94,297
21.4
22.3
24.5
27.1
13.3
12.1
5.6
5.3
42.6
46.0
2.0
1.8
Hind. Zinc
Neutral
267
-
112,858
14,252
18,465
55.9
48.3
15.8
21.5
16.9
12.4
2.8
2.4
17.0
20.7
7.9
6.1
Hindalco
Neutral
162
-
33,535
107,899
112,095
7.4
8.2
9.2
13.0
17.7
12.5
0.9
0.8
4.8
6.6
0.8
0.8
JSW Steel
Neutral
1,599
-
38,639
53,201
58,779
16.1
16.2
130.6
153.7
12.2
10.4
1.7
1.4
14.0
14.4
1.5
1.3
NMDC
Neutral
133
-
52,869
6,643
7,284
44.4
47.7
7.1
7.7
18.8
17.3
1.6
1.6
8.8
9.2
5.7
5.2
SAIL
Neutral
51
-
21,105
47,528
53,738
(0.7)
2.1
(1.9)
2.6
19.7
0.6
0.5
(1.6)
3.9
1.3
1.2
Vedanta
Neutral
218
-
64,571
71,744
81,944
19.2
21.7
13.4
20.1
16.3
10.8
1.4
1.3
8.4
11.3
1.3
1.0
Tata Steel
Neutral
403
-
39,169
121,374
121,856
7.2
8.4
18.6
34.3
21.7
11.8
1.4
1.2
6.1
10.1
1.0
0.9
Oil & Gas
Cairn India
Neutral
240
-
45,015
9,127
10,632
4.3
20.6
8.8
11.7
27.3
20.5
0.9
0.9
3.3
4.2
6.4
5.3
GAIL
Neutral
428
-
54,323
56,220
65,198
9.3
10.1
27.1
33.3
15.8
12.9
1.4
1.4
9.3
10.7
1.2
1.0
ONGC
Neutral
268
-
228,902
137,222
152,563
15.0
21.8
19.5
24.1
13.7
11.1
1.2
1.1
8.5
10.1
2.0
1.7
Indian Oil Corp
Neutral
310
-
150,412
373,359
428,656
5.9
5.5
54.0
59.3
5.7
5.2
0.9
0.8
16.0
15.6
0.6
0.5
Reliance Industries
Neutral
1,025
-
332,497
301,963
358,039
12.1
12.6
87.7
101.7
11.7
10.1
1.2
1.1
10.7
11.3
1.6
1.3
Pharmaceuticals
Alembic Pharma
Neutral
676
-
12,736
3,483
4,083
20.2
21.4
24.3
30.4
27.8
22.2
6.3
5.1
25.5
25.3
3.6
3.0
Aurobindo Pharma
Accumulate
770
877
45,055
15,720
18,078
23.7
23.7
41.4
47.3
18.6
16.3
4.8
3.8
29.6
26.1
3.1
2.7
Aventis*
Neutral
4,281
-
9,859
2,357
2,692
17.3
17.3
153.5
169.2
27.9
25.3
4.7
3.8
25.8
28.4
3.9
3.2
Cadila Healthcare
Neutral
397
-
40,591
11,126
13,148
22.0
22.0
17.1
20.0
23.2
19.8
6.0
4.7
28.8
26.6
3.7
3.0
Cipla
Neutral
559
-
44,924
15,378
18,089
17.4
18.4
21.6
27.2
25.9
20.6
3.4
2.9
13.7
15.2
3.1
2.6
Stock Watch
November 04, 2016
Company Name
Reco
CMP
Target
Mkt Cap
Sales ( Čcr )
OPM(%)
EPS (Č)
PER(x)
P/BV(x)
RoE(%)
EV/Sales(x)
(Č)
Price ( Č)
( Č cr )
FY17E FY18E
FY17E
FY18E
FY17E
FY18E
FY17E
FY18E
FY17E
FY18E
FY17E
FY18E
FY17E
FY18E
Pharmaceuticals
Dr Reddy's
Neutral
3,262
-
54,051
16,043
18,119
23.1
24.7
126.0
157.8
25.9
20.7
3.8
3.3
15.7
17.1
3.3
2.9
Dishman Pharma
Neutral
240
-
3,866
1,718
1,890
22.7
22.8
9.5
11.3
25.2
21.2
2.4
2.2
10.1
10.9
2.7
2.4
GSK Pharma*
Neutral
2,815
-
23,843
3,528
3,811
16.6
18.8
51.8
59.4
54.3
47.4
14.5
14.5
26.3
30.6
6.5
6.1
Indoco Remedies
Neutral
281
-
2,592
1,112
1,289
18.2
18.2
13.2
15.6
21.3
18.0
3.8
3.2
19.2
19.2
2.4
2.1
Ipca labs
Neutral
585
-
7,376
3,303
3,799
15.3
15.3
17.3
19.7
33.8
29.7
2.9
2.7
9.1
9.4
2.4
2.1
Lupin
Buy
1,474
1,809
66,433
15,912
18,644
26.4
26.7
58.1
69.3
25.4
21.3
4.9
4.0
21.4
20.9
4.2
3.5
Sun Pharma
Buy
705
944
169,672
31,129
35,258
30.0
30.9
28.0
32.8
25.2
21.5
3.9
3.2
18.7
18.9
5.0
4.3
Power
Tata Power
Neutral
77
-
20,745
36,916
39,557
17.4
27.1
5.1
6.3
15.0
12.2
1.3
1.2
9.0
10.3
1.6
1.4
NTPC
Neutral
153
-
126,114
86,605
95,545
17.5
20.8
11.8
13.4
13.0
11.4
1.3
1.2
10.5
11.1
2.8
2.8
Power Grid
Neutral
175
-
91,291
25,763
29,762
74.3
73.1
14.8
17.3
11.8
10.1
1.8
1.6
16.9
17.5
7.8
7.4
Real Estate
Prestige Estate
Accumulate
187
210
6,999
4,707
5,105
25.2
26.0
10.3
13.0
18.1
14.4
1.5
1.4
10.3
10.2
2.7
2.4
MLIFE
Buy
416
522
1,709
1,152
1,300
22.7
24.6
29.9
35.8
13.9
11.6
1.0
1.0
7.6
8.6
2.2
1.8
Telecom
Bharti Airtel
Neutral
310
-
123,740
105,086
114,808
34.5
34.7
12.2
16.4
25.4
18.9
1.7
1.6
6.8
8.4
2.1
1.8
Idea Cellular
Neutral
74
-
26,502
40,133
43,731
37.2
37.1
6.4
6.5
11.5
11.3
1.0
0.9
8.2
7.6
1.7
1.4
zOthers
Abbott India
Neutral
4,708
-
10,004
3,153
3,583
14.1
14.4
152.2
182.7
30.9
25.8
151.9
129.7
25.6
26.1
2.9
2.5
Asian Granito
Buy
265
351
797
1,071
1,182
12.1
12.4
12.7
16.0
20.8
16.6
2.0
1.8
9.5
10.7
1.0
0.9
Bajaj Electricals
Buy
257
306
2,600
5,099
5,805
5.6
5.9
11.4
14.6
22.6
17.7
3.0
2.7
13.4
15.1
0.5
0.4
Banco Products (India)
Neutral
214
-
1,531
1,353
1,471
12.3
12.4
14.5
16.3
14.8
13.1
20.4
18.4
14.5
14.6
1.1
115.1
Coffee Day Enterprises
Neutral
222
-
4,572
2,964
3,260
20.5
21.2
4.7
8.0
-
27.7
2.6
2.4
5.5
8.5
2.0
1.7
Ltd
Competent Automobiles Neutral
194
-
119
1,137
1,256
3.1
2.7
28.0
23.6
6.9
8.2
37.3
33.7
14.3
11.5
0.1
0.1
Elecon Engineering
Neutral
64
-
697
1,482
1,660
13.7
14.5
3.9
5.8
16.4
11.0
3.9
3.5
7.8
10.9
0.8
0.7
Finolex Cables
Neutral
437
-
6,688
2,883
3,115
12.0
12.1
14.2
18.6
30.8
23.5
16.4
14.3
15.8
14.6
2.0
1.8
Garware Wall Ropes
Neutral
552
-
1,207
873
938
12.9
13.1
30.9
34.9
17.9
15.8
2.8
2.4
15.7
15.2
1.3
1.2
Goodyear India*
Neutral
781
-
1,801
1,598
1,704
10.4
10.2
49.4
52.6
15.8
14.9
73.0
64.0
18.2
17.0
0.8
114.2
Hitachi
Neutral
1,493
-
4,060
2,081
2,433
8.8
8.9
33.4
39.9
44.7
37.4
36.1
30.1
22.1
21.4
1.9
1.6
HSIL
Neutral
349
-
2,525
2,384
2,515
15.8
16.3
15.3
19.4
22.8
18.0
22.7
19.5
7.8
9.3
1.2
1.1
Interglobe Aviation
Neutral
933
-
33,621
21,122
26,005
14.5
27.6
110.7
132.1
8.4
7.1
50.4
36.0
168.5
201.1
1.6
1.2
Jyothy Laboratories
Neutral
354
-
6,429
1,440
2,052
11.5
13.0
8.5
10.0
41.7
35.4
10.1
9.3
18.6
19.3
4.7
3.3
Kirloskar Engines India
Neutral
345
-
4,990
2,554
2,800
9.9
10.0
10.5
12.1
32.9
28.5
13.8
13.0
10.7
11.7
1.6
1.4
Ltd
Stock Watch
November 04, 2016
Company Name
Reco
CMP
Target
Mkt Cap
Sales ( Čcr )
OPM(%)
EPS (Č)
PER(x)
P/BV(x)
RoE(%)
EV/Sales(x)
(Č)
Price ( Č)
( Č cr )
FY17E
FY18E
FY17E
FY18E
FY17E
FY18E
FY17E
FY18E
FY17E
FY18E
FY17E
FY18E
FY17E
FY18E
zOthers
Linc Pen & Plastics
Neutral
253
-
374
382
420
9.3
9.5
13.5
15.7
18.8
16.1
3.2
2.8
17.1
17.3
1.0
0.9
M M Forgings
Neutral
449
-
542
546
608
20.4
20.7
41.3
48.7
10.9
9.2
61.6
54.5
16.6
17.0
0.8
0.8
Manpasand Bever.
Neutral
706
-
4,034
836
1,087
19.6
19.4
16.9
23.8
41.8
29.6
5.0
4.4
12.0
14.8
4.6
3.4
Mirza International
Buy
89
113
1,074
1,024
1,148
18.0
18.0
6.9
8.0
12.9
11.2
2.2
1.9
16.6
16.2
1.2
1.1
MT Educare
Neutral
136
-
541
366
417
17.7
18.2
9.4
10.8
14.5
12.6
3.2
2.8
22.2
22.3
1.4
1.2
Narayana Hrudaya
Neutral
340
-
6,946
1,873
2,166
11.5
11.7
2.6
4.0
128.5
85.7
7.9
7.1
6.1
8.3
3.8
3.3
Navkar Corporation
Buy
202
265
2,881
408
612
42.9
42.3
6.8
11.5
29.8
17.6
2.1
1.9
6.9
10.5
8.0
5.3
Navneet Education
Neutral
106
-
2,536
1,062
1,147
24.0
24.0
6.1
6.6
17.5
16.1
3.6
3.2
20.6
19.8
2.5
2.3
Nilkamal
Neutral
1,717
-
2,562
1,995
2,165
10.7
10.4
69.8
80.6
24.6
21.3
98.1
85.2
16.6
16.5
1.3
1.1
Page Industries
Neutral
15,789
-
17,611
2,450
3,124
20.1
17.6
299.0
310.0
52.8
50.9
351.6
268.4
47.1
87.5
7.2
5.7
Parag Milk Foods
Neutral
307
-
2,580
1,919
2,231
9.3
9.6
9.5
12.9
32.5
23.7
5.0
4.2
15.5
17.5
1.5
1.3
Quick Heal
Neutral
242
-
1,692
408
495
27.3
27.0
7.7
8.8
31.2
27.5
2.9
2.9
9.3
10.6
3.3
2.7
Radico Khaitan
Neutral
139
-
1,845
1,659
1,802
13.0
13.2
6.3
7.4
21.9
18.8
1.9
1.7
8.6
9.3
1.5
1.4
Relaxo Footwears
Neutral
416
-
4,995
2,085
2,469
9.2
8.2
7.6
8.0
55.1
52.4
21.3
18.2
17.9
18.8
2.5
2.1
S H Kelkar & Co.
Neutral
311
-
4,503
1,036
1,160
15.1
15.0
6.1
7.2
51.0
43.4
5.5
5.0
10.7
11.5
4.2
3.7
Siyaram Silk Mills
Accumulate
1,545
1,714
1,448
1,799
2,040
11.6
11.7
104.9
122.4
14.7
12.6
2.4
2.1
16.4
16.4
1.0
0.9
Styrolution ABS India*
Neutral
625
-
1,099
1,440
1,537
9.2
9.0
40.6
42.6
15.4
14.7
39.3
35.7
12.3
11.6
0.7
0.6
Surya Roshni
Neutral
231
-
1,010
3,342
3,625
7.8
7.5
17.3
19.8
13.3
11.7
25.3
20.3
10.5
10.8
0.6
0.5
Team Lease Serv.
Neutral
1,028
-
1,758
3,229
4,001
1.5
1.8
22.8
32.8
45.2
31.3
4.8
4.2
10.7
13.4
0.4
0.3
The Byke Hospitality
Neutral
186
-
748
287
384
20.5
20.5
7.6
10.7
24.5
17.4
5.1
4.1
20.7
23.5
2.6
2.0
Transport Corporation of
Neutral
185
-
1,418
2,671
2,911
8.5
8.8
13.9
15.7
13.4
11.8
1.8
1.6
13.7
13.8
0.6
0.6
India
TVS Srichakra
Neutral
3,746
-
2,868
2,304
2,614
13.7
13.8
231.1
266.6
16.2
14.1
420.9
331.4
33.9
29.3
1.2
1.1
UFO Moviez
Neutral
475
-
1,311
619
685
33.2
33.4
30.0
34.9
15.9
13.6
2.2
1.9
13.8
13.9
1.8
1.5
Visaka Industries
Neutral
221
-
352
1,051
1,138
10.3
10.4
21.0
23.1
10.5
9.6
28.4
26.6
9.0
9.2
0.6
0.6
VRL Logistics
Neutral
284
-
2,587
1,902
2,119
16.7
16.6
14.6
16.8
19.5
16.9
4.3
3.7
21.9
22.2
1.5
1.3
Wonderla Holidays
Neutral
380
-
2,147
287
355
38.0
40.0
11.3
14.2
33.6
26.8
4.8
4.2
21.4
23.9
7.2
5.8
Source: Company, Angel Research; Note: *December year end; #September year end; &October year end; Price as on November 03, 2016
Market Outlook
November 04, 2016
Research Team Tel: 022 - 39357800
DISCLAIMER
Angel Broking Private Limited (hereinafter referred to as “Angel”) is a registered Member of National Stock Exchange of India
Limited,Bombay Stock Exchange Limited and Metropolitan Stock Exchange Limited. It is also registered as a Depository Participant with
CDSL and Portfolio Manager with SEBI. It also has registration with AMFI as a Mutual Fund Distributor. Angel Broking Private Limited is a
registered entity with SEBI for Research Analyst in terms of SEBI (Research Analyst) Regulations, 2014 vide registration number
INH000000164. Angel or its associates has not been debarred/ suspended by SEBI or any other regulatory authority for accessing
/dealing in securities Market. Angel or its associates/analyst has not received any compensation / managed or
co-managed public offering of securities of the company covered by Analyst during the past twelve months.
This document is solely for the personal information of the recipient, and must not be singularly used as the basis of any investment
decision. Nothing in this document should be construed as investment or financial advice. Each recipient of this document should make
such investigations as they deem necessary to arrive at an independent evaluation of an investment in the securities of the companies
referred to in this document (including the merits and risks involved), and should consult their own advisors to determine the merits and
risks of such an investment.
Reports based on technical and derivative analysis center on studying charts of a stock's price movement, outstanding positions and
trading volume, as opposed to focusing on a company's fundamentals and, as such, may not match with a report on a company's
fundamentals. Investors are advised to refer the Fundamental and Technical Research Reports available on our website to evaluate the
contrary view, if any.
The information in this document has been printed on the basis of publicly available information, internal data and other reliable
sources believed to be true, but we do not represent that it is accurate or complete and it should not be relied on as such, as this
document is for general guidance only. Angel Broking Pvt. Limited or any of its affiliates/ group companies shall not be in any way
responsible for any loss or damage that may arise to any person from any inadvertent error in the information contained in this report.
Angel Broking Pvt. Limited has not independently verified all the information contained within this document. Accordingly, we cannot
testify, nor make any representation or warranty, express or implied, to the accuracy, contents or data contained within this document.
While Angel Broking Pvt. Limited endeavors to update on a reasonable basis the information discussed in this material, there may be
regulatory, compliance, or other reasons that prevent us from doing so.
This document is being supplied to you solely for your information, and its contents, information or data may not be reproduced,
redistributed or passed on, directly or indirectly.
Neither Angel Broking Pvt. Limited, nor its directors, employees or affiliates shall be liable for any loss or damage that may arise from
or in connection with the use of this information.